Category: statistics
-
Recovering numeric data from an image of a graph
Sometimes all you have is an image file (perhaps from a scanned publication) and you would like to convert the data points to xy coordinates (maybe you want to try an analysis on someone else's data). R gives some tools to help. Here is the start of some code:renfreeshawlab.science.unimelb.edu.au/2020/07/04/recovering-numeric-data-from-an-image-of-a-graph
-
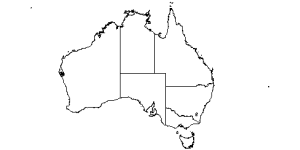
Mapping with R
Easy map making in Rrenfreeshawlab.science.unimelb.edu.au/2020/04/21/mapping-with-r
-
Organising data in Excel for analysis, part 2
Save processing time and manipulate y our data with ease using the Power Query Editor in Excelrenfreeshawlab.science.unimelb.edu.au/2018/09/17/organising-data-in-excel-for-analysis-2
-
Organising data in Excel for analysis
From time to time I get asked to help with a statistical analysis. When I ask for the data I often get a spreadsheet like this. OK, I can read this and sometimes make sense of it, but there are a number of important issues including: With a little bit of learning, this can all […]renfreeshawlab.science.unimelb.edu.au/2018/09/04/organising-data-in-excel-for-analysis