Mapping with R
I recently had to make some maps of species distributions. To avoid copyright issues from copying other people’s maps you can use Open Street Map (https://www.openstreetmap.org) which provides open source maps, but if you want just plain country outline maps without all the clutter, you can make these quickly using R from freely available packages and datasets. One that is good for Australia is package ozmaps. A couple of lines of code will generate a nice map of Australia (with or without state boundaries).
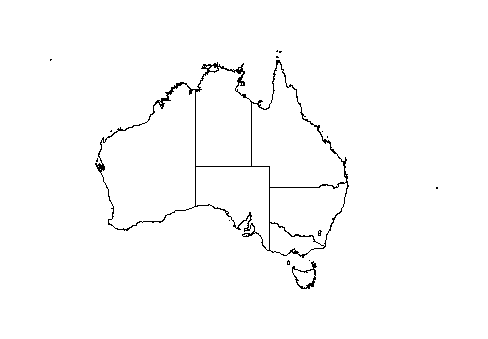
library(ozmaps)
ozmap()
ozmap("country") # gives outline without state borders
The resulting map can be exported as PDF (this exports as a vector image that you can zoom to the desired size, import into photoshop or illustrator (or alternatives like GIMP and Inkscape) for further manipulation. In R you can add other shapes (outlines of polygons in latitude/longitude lists) etc.
If you want to skip the intermediate steps, you can export the map directly from R to an SVG vector graphic file that you can import into Powerpoint for further manipulation.
svg(filename = "test3.svg")    # send output to an SVG file with the name specified
ozmap(lwd=1)                   # draw the map (lwd=1 specifies a thin line width)
dev.off()                      # finish writing to the file and close it.
Now, import the SVG file into Powerpoint as an image (menu: INSERT>>Image). resize the image on the page to the desired size. Ungroup the image to detach the map from the svg page background. Ungroup again to get the various vector parts ungrouped, if you want to adjust line colour or thickness or shape fill, you can select the parts and adjust as desired. Here is a map I have adjusted the fill colours on:


Now, you might want to add some embellishments like, say, selecting just a part of the map. This is easily achieved within PowerPoint using the Merge Shapes tool. For example, perhaps you want just the part around Victoria on your map. Make a country outline map SVG file, paste into PPT, ungroup and set line and fill as desired. Use the draw rectangle tool to make a box over the desired area. Shift-click to add the selection of the country outline.


Now use the Merge-Shapes >> Intersect. from the Shape-Format menu.

Have a play. You can use the shape drawing tools to make arbitrary polygonal or smoothed polygon shapes etc. The Merge shapes tools don’t work with grouped shapes or with too many shapes, so you may need to tidy up the result by deleting all the left over island shapes etc that weren’t used in the shape-union. Since the lines are imported as vectors, you can resize to make the shapes bigger without getting pixelated.
Want maps of elsewhere? There are lots more options. The code below uses different packages to plot a map of Australia, Papua and Indonesia, for example. start and end this with the svg(filename) and dev.off() code as illustrated above to get svg output.
library(maps)
library(mapdata)
library(sp)

aus<-  map(database = "worldHires",
         regions = c("Australia","papua","indonesia"),
         fill=FALSE,
         xlim=c(100,170), # longitude range
         ylim=c(-45,-0),  # latitude range
         mar=c(0,0,0,0),
         plot = TRUE,
         resolution = 0,
         lwd=3  # line width
         )
Have fun.